Results: Spatially mapping soil and landscape properties
Data analysis of the 450 soil cores taken on a gridded basis across the semi-improved field site (ca. 11 ha) have been mapped in GIS and a vegetation survey has been conducted. See below for some of the maps at the semi-improved field site, including soil pH (Fig. 1), soil electrical conductivity (Fig. 2), soil organic matter (Fig. 3), soil nitrate (Fig. 4), soil ammonium (Fig. 5) and the results of a vegetation survey (Fig. 6). Check again soon for further analyses and mapping.
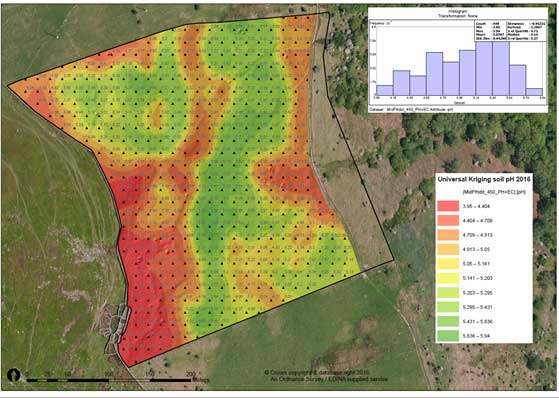
Fig. 1 Distribution of soil pH across the 11 ha, semi-improved field site.
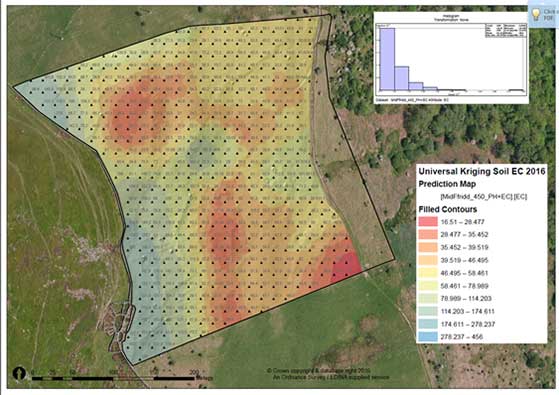
Fig. 2 Soil electrical conductivity across the 11 ha, semi-improved field site.
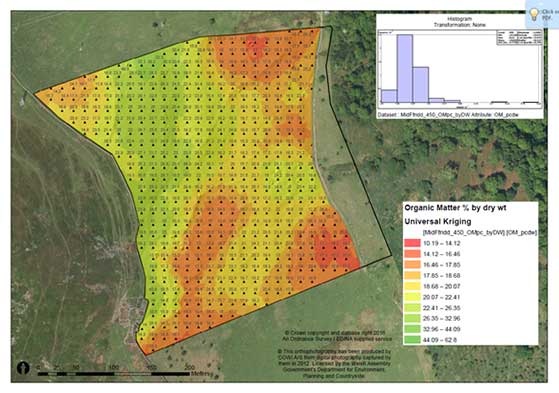
Fig. 3 Soil organic matter (% based on soil dry weight) across the 11 ha, semi-improved field site.
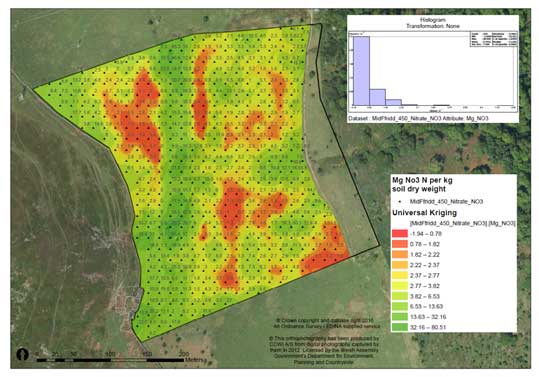
Fig 4. 0.5M K2SO4 – extractable nitrate (mg NO3-- N kg-1 soil dry weight) across the 11 ha, semi-improved field site.
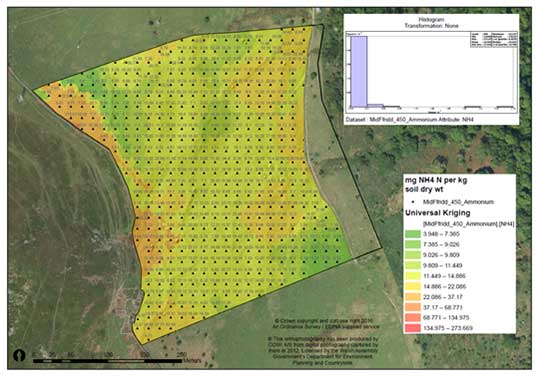
Fig. 5 0.5M K2SO4 – extractable ammonium (mg NH4+- N kg-1 soil dry weight) across the 11 ha, semi-improved field site.
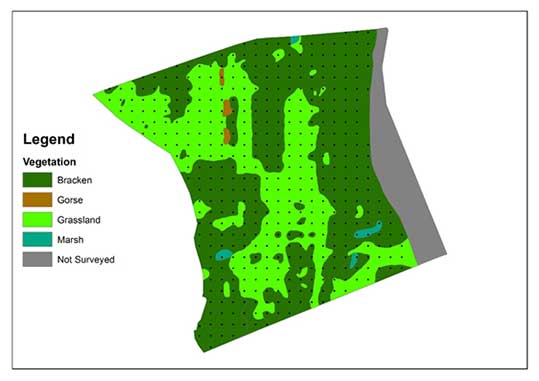
Fig. 6 Vegetation survey of the 11 ha, semi-improved field site.